How to Analyze Tokenomics?

When researching new projects, one of the most important aspects is to analyze the token’s utility, distribution, and release schedule, commonly referred to as tokenomics. Understanding tokenomics is crucial because a token’s price is influenced by its supply dynamics, including the total and circulating amounts. A token’s price stability is also impacted by its distribution strategy and vesting, or rate of release into the market.
How many tokens are there?
Users first need to determine the token supply by analyzing its maximum and circulating supply. The maximum supply will tell you how many tokens will ever exist. Most tokens will choose a fixed supply as this will eventually counter inflation of the token while some have an infinite supply to improve liquidity.
The choice of a fixed or infinite supply typically depends on inflation considerations, with the first making it more difficult to onboard new users as there are fewer tokens to go around, with the opposite effect in the infinite token supply instance. At the same time, the token price might be impacted by infinite supply, with existing token holders getting slightly diluted over time.
The circulating supply indicates how many tokens are liquid in the market and can be bought or sold. Using this figure, one can calculate the token’s market capitalization as its circulating supply x token price. For the fully diluted market capitalization, one should use maximum supply x token price.
For example, token A has a circulating supply of 1,000,000 tokens of $1 and a total supply of 100,000,000 tokens.
Market capitalization = 1,000,000 * $1 = $1,000,000
Fully diluted market capitalization = 100,000,000 * $1 = $100,000,000
A significant difference between the two figures, such as the example above, suggests that 99% of the tokens still need to enter circulation, impacting a token’s price and stability.
For instance, if the market capitalization is $1,000,000 with 1,000,000 tokens at $1 each, and 200,000 additional tokens enter circulation without a change in demand, the price per token should drop to approximately $0.83.
$1,000,000 / 1,200,000 tokens = $0.83
Who gets how many tokens and can they influence the token price?
Due to the transparency of the cryptocurrency space, one can look at vesting schedules to determine future token issuance and estimate its market impact, as tokens get distributed across different project stakeholders.
These projects usually have a long journey before they enter the liquid, tradeable market and this journey is commonly funded via venture capital to support the core team and their technological aspirations as well as to guarantee a successful public launch.
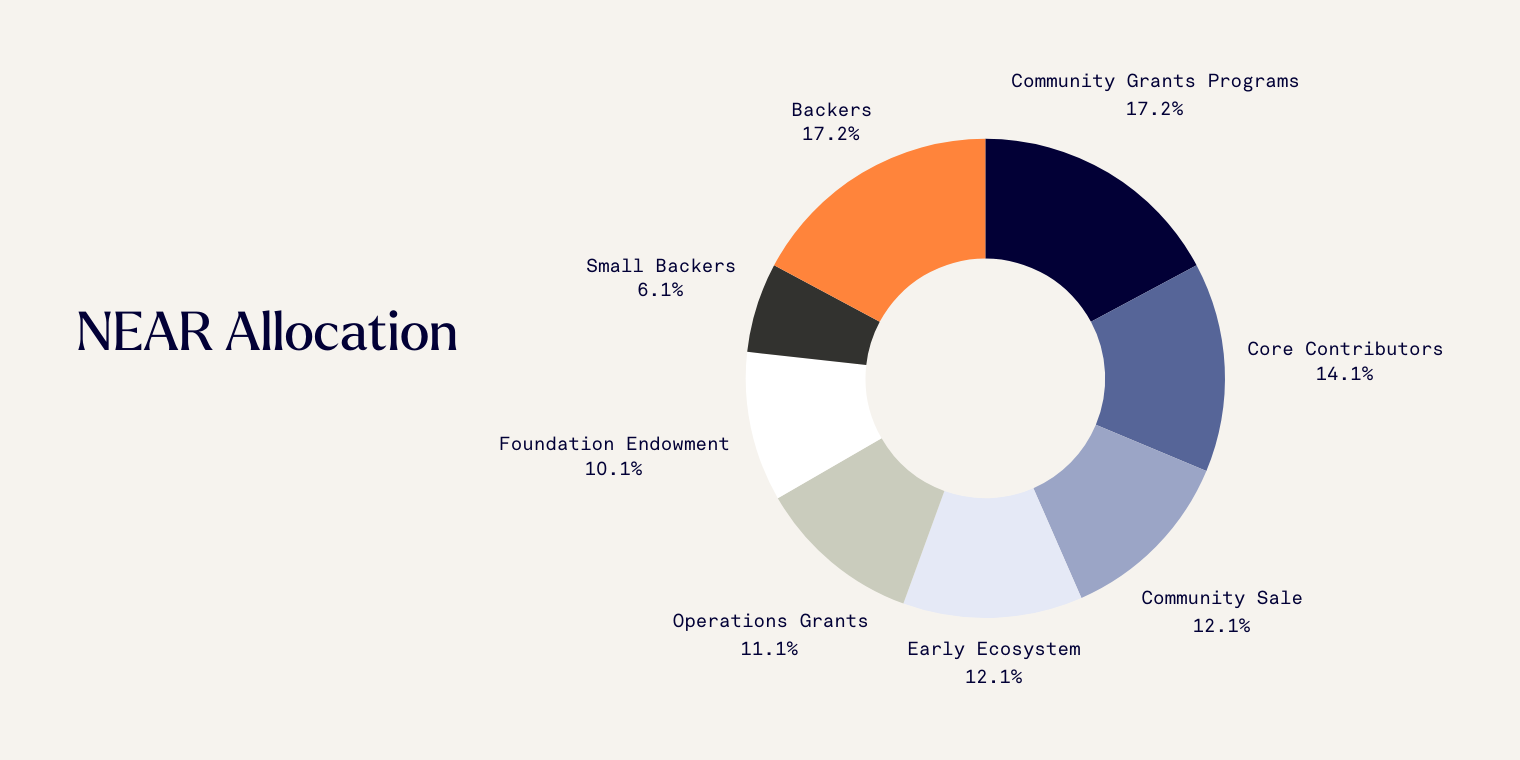
Thus, to fund the past and future, the project distributes the token among various stakeholders such as the team, advisors, and venture round(s) and also across its community for incentives, grants, airdrops, and general ecosystem development. For instance, the illustration below demonstrates the token distribution of the $NEAR token.

Source: https://www.coingecko.com/en/coins/near#tokenomics
The most important aspect here is that the allocations are well-structured, rewarding early users whilst still incentivizing people to build in the ecosystem and use the token. Every allocation should have a long-term vision which can be determined through the vesting schedule.
The vesting schedule shows when a certain allocation will start introducing tokens into the circulating supply. Let’s consider an example where the team allocation is 10% of the total supply and they have a one-year cliff with a linear vest of 10 months. This jargon is fairly typical across the crypto space, which means that if a token launches on January 1st 2025, the team will start receiving tokens one year after the token generation event (TGE) at a rate of 1% of the total supply per month, for the length of 10 months.
An allocation size of 10% for a team is common, fluctuating between 10% and 20%. However, a warning scenario could be if the team’s allocation is fully in circulation in less than two years, indicating a focus on short-term value creation rather than long-term growth.
Additionally, releasing 1% of the total supply each month for ten months creates significant inflation and selling pressure. It is crucial to determine how much selling pressure and inflation the token will experience and whether this will occur over a short or long period, as this will affect the token's price stability.
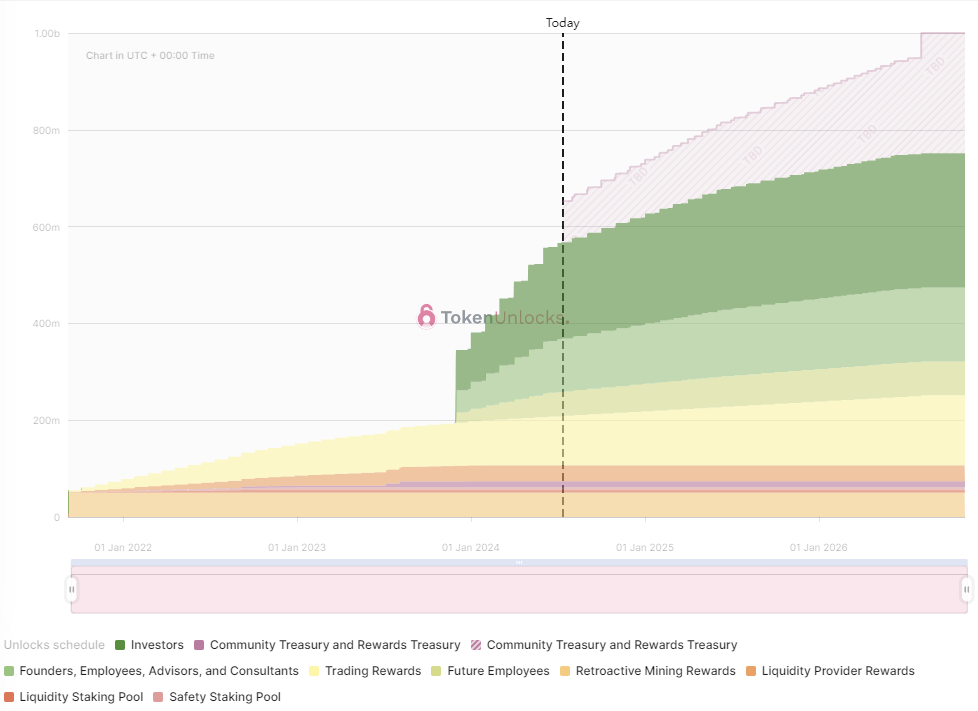
In the illustration below, one can observe an aggressively designed vesting schedule from dYdX. Note that the schedule has a large spike, causing high inflation and likely pushing the price down, assuming no other changes that could potentially influence demand.

Source: https://token.unlocks.app/dydx
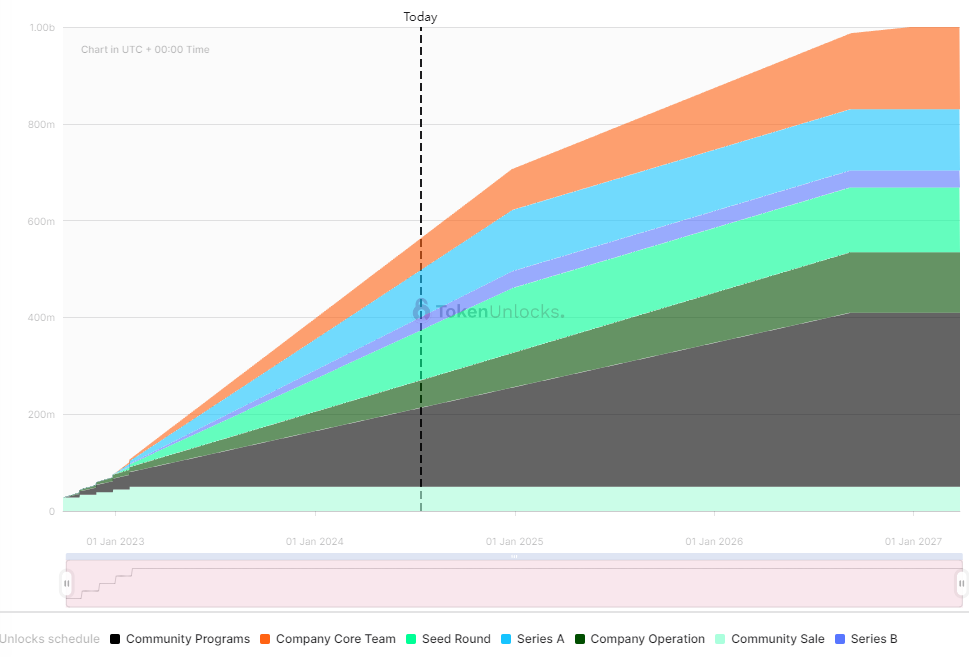
In contrast, the second illustration shows a more balanced vesting schedule by Axelar. New tokens are issued gradually to the market, causing no sudden selling pressure and allowing the project to find its product-market fit and achieve meaningful adoption. This way, the network effects of Axelar’s growth could potentially outpace its token inflation over time.

Source: https://token.unlocks.app/axelar
Despite the importance of vesting schedules and token distributions, one has also to take into account the utility of a token as there needs to be an underlying reason for its existence.