ZK Series: What is a Sharpe Ratio?

- Key Takeaways
- An introduction to the Sharpe Ratio
- What is a Sharpe Ratio?
- The calculation of a Sharpe Ratio
- What is a good Sharpe Ratio?
Key Takeaways
- Returns alone are not enough: Returns tells you how much you earned, but not how much risk you took to get there.
- Sharpe = return per unit of risk: The Sharpe Ratio shows how much extra return you get per unit of risk that you are taking.
- Higher Sharpe = higher quality strategy: A higher Sharpe Ratio means more efficient use of risk; professional strategies typically aim for a Sharpe above 2.0, combining growth with better protection of your capital.
Introduction to the Sharpe Ratio
In an environment of persistent inflation, simply holding cash is no longer a strategy; it is a guaranteed loss of purchasing power over time. Making the right investment decisions becomes essential, but focusing only on returns can be misleading if you ignore the risk taken to achieve them. This is where the Sharpe Ratio comes in: it shifts the focus from raw performance to risk-adjusted performance, helping investors distinguish between strategies that merely produce high returns and those that deliver those returns efficiently and sustainably.
What is a Sharpe Ratio?
The Sharpe Ratio measures risk-adjusted return. In simple terms, it shows how much extra return you get for each unit of risk you take. It does this by comparing the return of an investment to a “risk-free” alternative and then looking at how much the results fluctuate over time. A higher Sharpe Ratio means the strategy is using risk more efficiently, which helps you decide whether the return you see is actually worth the risk behind it.
The calculation of a Sharpe Ratio
To calculate the Sharpe Ratio, we need 3 things: the average return of the portfolio, the risk-free rate and the standard deviation of portfolio returns.
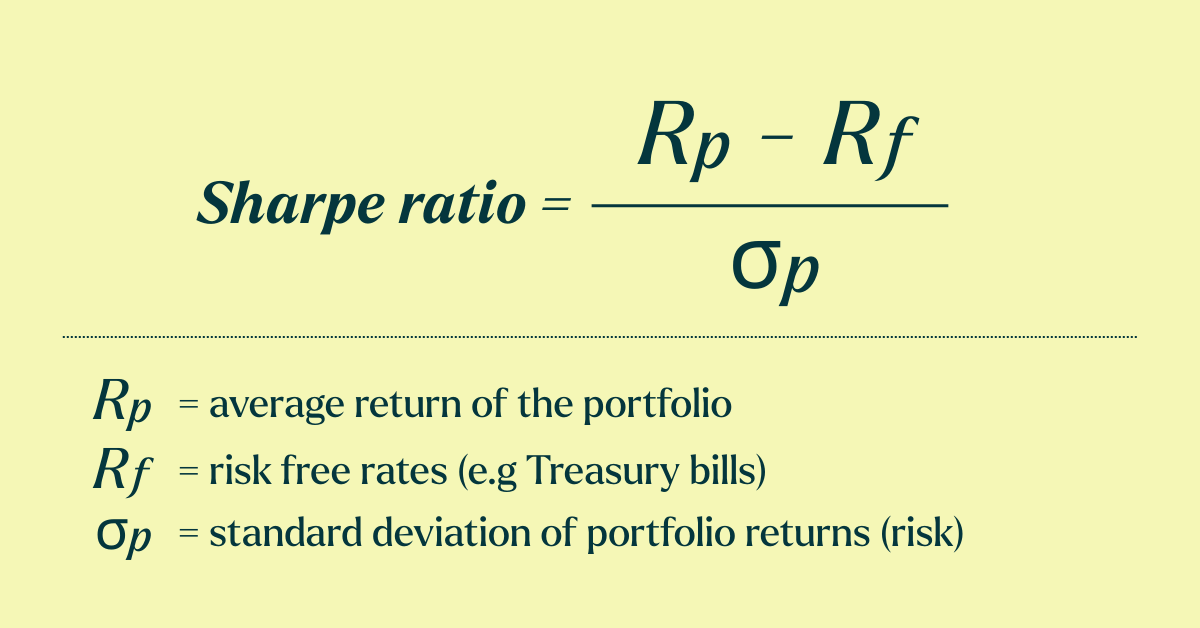
Rp = Average Return of the Porfolio
This is the average return your investment generates over a specific period (daily, monthly, yearly).
Rf = Risk-Free Rate
This is the return you could get without taking any risk. Very often, Treasury Bills (T-Bills) are being used as a Risk-Free Rate as they are fully backed by the government.
Even though people call it the Risk-free Rate and assume no risk, trading firms often disagree, as Risk-free returns don’t really exist; there are always risks.
Rp - Rf = Excess Return
By deducting the Risk-Free Rate from the Average Return, you get the Excess Return. This gives a clear indication of the additional returns the strategy or portfolio is generating.
σp = Standard Deviation
The Standard Deviation is the most common way to measure volatility. This will be measured over the same period as the Average Return of the Portfolio.
- Higher volatility = higher risk.
- Example: If a stock sometimes jumps 20% up and sometimes drops 15%, it’s riskier than a stock that sometimes jumps 5% up and sometimes drops 3%. While performance could be exactly the same between the two. The calculation of the portfolio's standard deviation is more complex and will not be explained in detail in this blog. The standard deviation is a spread score that tells you whether most numbers stay close to the average or are scattered apart.
In simple terms; “Volatility is important because even a strategy that wins 70% of the time can experience long losing streaks before the long-term projection plays out. Standard deviation measures how large those swings can be.”
Example calculation
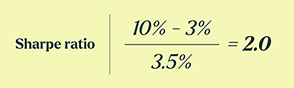
Let's run an example calculation. We will use the following numbers:
- Rp: We will use an average return of 10% per year
- Rf: For the risk-free rate we will use a U.S. Treasury bill that returns 3% per year
- σp: The standard deviation will be set at 3.5%
To calculate the Excess Return the strategy generates, we start by deducting the Risk-Free Rate. 10% minus 3%, gives us an excess return of 7%.
Deviding the Excess Return of 7% by the Standard Deviation of 3.5%, givus us a Sharpe Ratio of 2.0.
What is a good Sharpe Ratio?
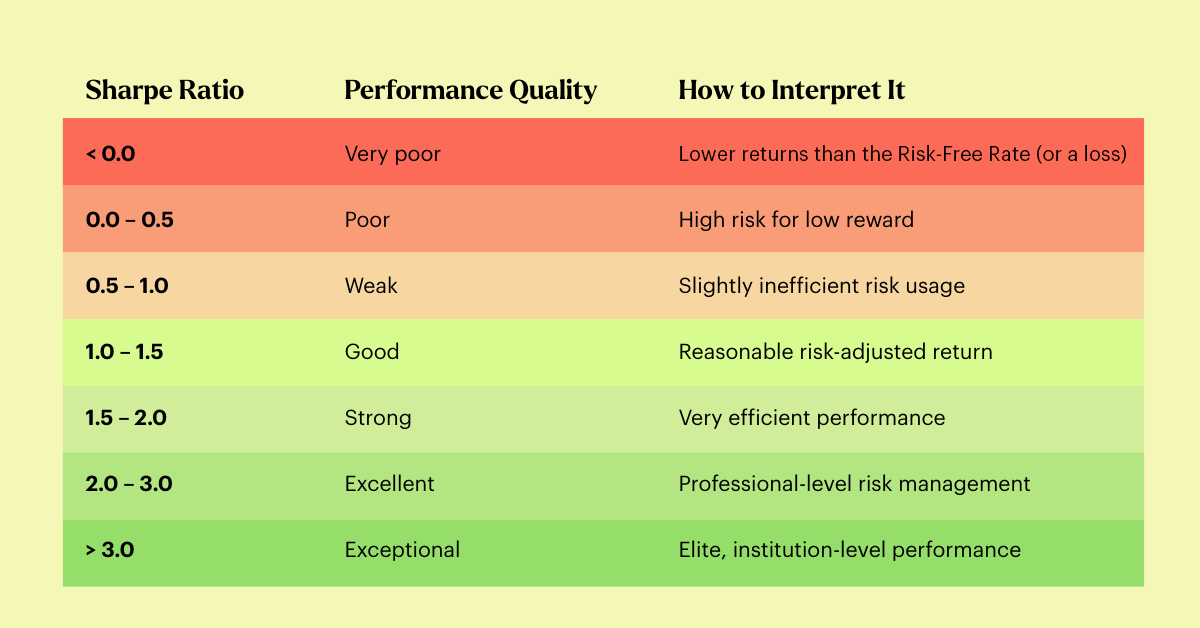
The interpretation of a Sharpe ratio is not 100% set in stone, and it is up to the investor or trading firm to define what they deem appropriate. But what is certain is that a higher Sharpe means more efficient use of risk. Below you will find an overview of generally accepted ranges by trading firms to judge quality, from “not worth the risk” to “institutional-level performance.”
Conclusion
The Sharpe Ratio is a way to look beyond raw returns and understand how efficiently a strategy uses risk; in other words, how much extra return you get for the volatility you endure. It helps investors compare strategies and avoid returns that only look attractive because they were achieved with excessive risk.
The ZK Fund is explicitly designed for market-neutral and high-Sharpe strategies, aiming to generate stable, risk-adjusted returns with a target Sharpe Ratio of at least 3.0 over time. If you would like to dive deeper into the fund’s strategy, structure and historical and backtest data, you can download the Key Fact Sheet via the link below.